Good afternoon, dear followers of RVM systems,
Here is our monthly overview for July.
Because the first day of August fell in the last week of July, last week was still included in the July overview.
In addition to the 'dry' monthly overview, it might also be useful to mention a few things to take into account when designing an investment methodology.
And a brief explanation of why the markets took such a sharp downturn last week.
WHY DID EVERYTHING GO SO WRONG?
Those who receive RVM Analysis, our daily stock market news publication, have known for a few weeks that there has been a so-called trend short signal within our methodology since mid-July.
Our self-designed trend indicator is part of our toolkit, and it generates trend signals more or less mechanically.
We usually do not notice the signals from this indicator because the statistics of the signal are not strong enough, but it is factual market information. In March 2025, for example, we did notice the signal from the trend indicator, and a month later, this turned out to have been a good idea when the US president caused a stock market crash.
But that's beside the point.
If the trend indicator is short and we do not take a position on it, we should certainly not go against it with upward-trending positions in derivatives, unless there are additional conditions that are favorable enough, again based on big data.
This is how it works.
At the bottom of this letter, you will see this illustrated with a graph.
So we keep track of the statistics for this crucial signal, and we will continue to do so; our data analysis is ongoing.
The trend signal in mid-July was unprofitable until the end of July for those who had observed it.
So it is impossible to say, even with a trend signal that proves to be correct in hindsight, how long it will take to work out, or whether it will be and remain loss-making and the position will be closed out.
In any case, the market in Amsterdam ultimately fell more or less in a straight line from 916 to 882, almost -4%, from Thursday morning, July 31, to Friday afternoon, August 1.
We did not have a position on it, but within our data analysis, the trend indicator has now been given a positive check mark again.
It was still the right signal, even though we had to wait a few weeks for it.
NOW, A HOPEFULLY INTERESTING EXPLANATION OF HOW WE MANAGE OUR RISK, BASED PRIMARILY ON STATISTICS.
Our option strategy system has many components, the trend indicator being just one of them.
There are also several quantitative systems, i.e. calculations, that determine the permitted position selection.
What matters most: data, lots of data, and with it statistics, and with it the basis for probability calculations.
Probability calculation is everything on the stock market, and the goal is to optimize it as much as possible.
AUGUST 1991
Now a little more about the 'big data' that is crucial when designing a trading system.
An important moment in the history of the AEX stock exchange was a weekend in August 1991.
Take a look at the AEX chart showing the transition from Friday to Monday in August 1991:
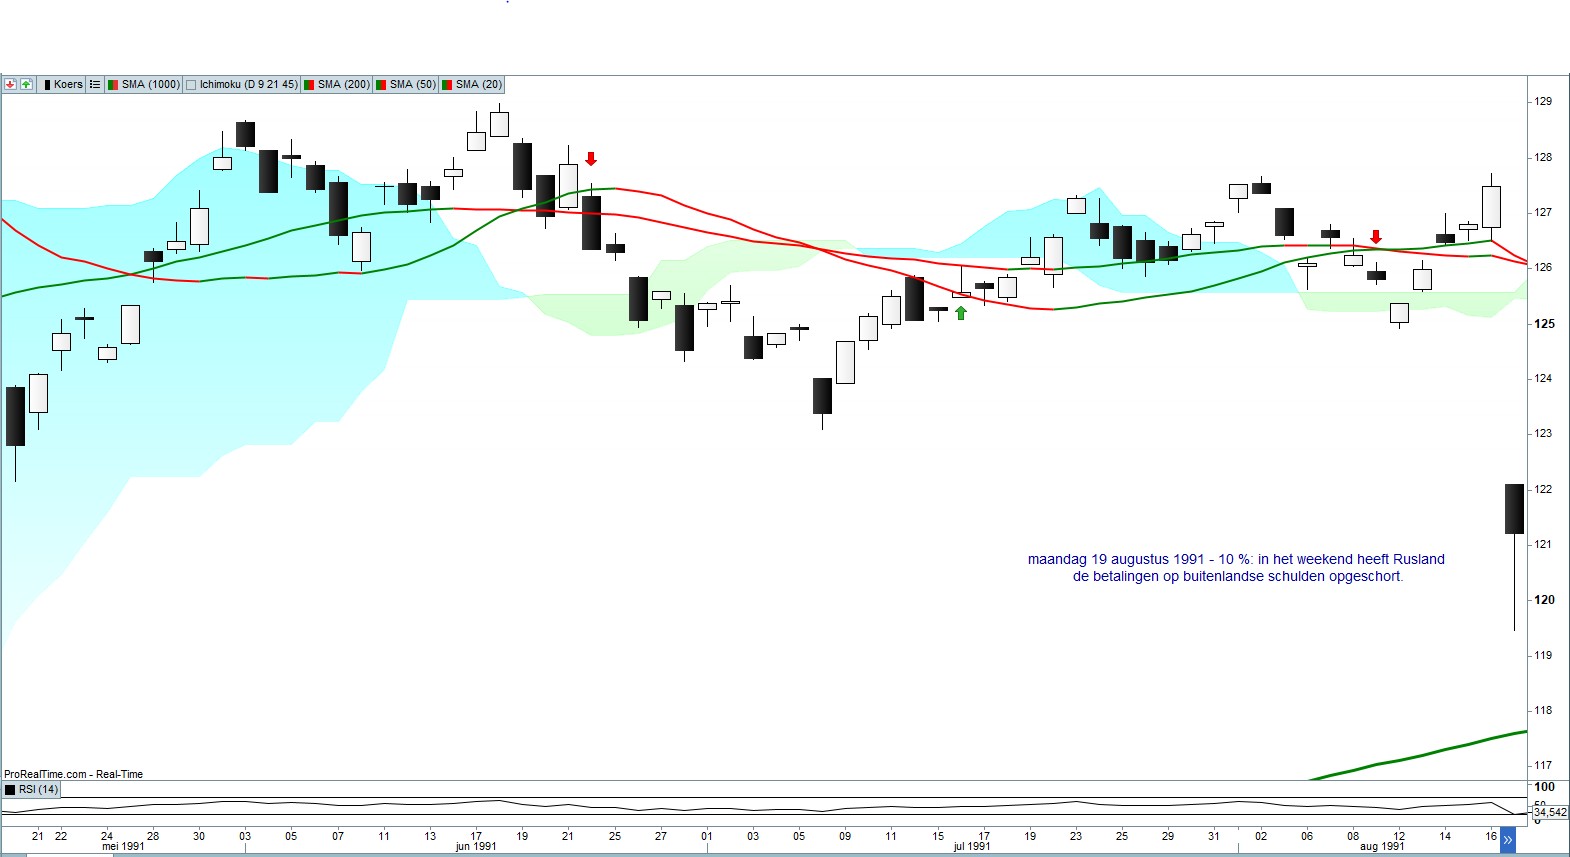
What do we see here?
We see a 10% drop in the AEX in one day, starting from the weekend.
Is a 10% drop in one day a problem for shareholders?
No, that can just be part of it and it happens regularly, especially in response to grades.
However, in the case of indices, this is highly unusual and therefore an important statistic for stock market systematics.
Anyone who held an uncovered written put option on the AEX index here on Friday afternoon in 1991 in order to profit from a rising or stable index ran the risk not only of incurring huge losses between Friday afternoon and Monday morning, but also of margin calls if it was a 'naked' written put.
The fundamental reason for the shock in the financial markets was that Russia decided that weekend to stop paying interest on government bonds.
Has something like that ever happened again?
Yes, we saw a similar financial shock in 2016, after the Brexit vote in the UK.
Such data is now built into the RVM systems, hence the example.
If something like this were to happen again, we would have to be able to cope with it.
A key to this can be found in the red arrow you see in the chart, six trading days before Russia shocked the world market in 1991.
This red arrow is part of our self-designed trend indicator system; it does not necessarily mean that insurance against a decline should be taken out here, but it does mean that no written puts are possible.
Other long positions in derivatives are also inadvisable.
In other words, even six days before the shock on the stock market occurred at the time, it was known within RVM systems, with such a setup, that despite all the positive developments on the stock market throughout the week prior to this overnight crash, long positions should not be entered into.
There is therefore a reason why RVM systems did not suffer any losses during active trading during the Corona crash in 2020 and during many other severe market downturns.
This is due to the incorporation of a large amount of data and the trading rules that must follow from these statistics.
CAN YOU PREVENT ALL DISASTERS?
No, that won't work, of course.
There will always be things that fall outside our statistics.
But we're getting pretty far, let's leave it at that.