
March was a very weak month for the AEX, with a decline of 6.55%.
The performance figures for the RVM systems in March were: RVM Strategy +1.55%;
RVM Retirement +1.47%.
. This marks the ninth consecutive month that the indices have hit new all-time
highs.
THE MARKET IN MARCH: WAR
The main cause of the market decline in March was the attack on
Iran by the US and Israel. On February 28, Israel and the US launched an airstrike against Iran from
, primarily with the aim of assassinating Ayatollah Khamenei, along with
other senior figures in Iran, such as those in the
Revolutionary Guard.
What could possibly be a “good” outcome for the world from such a
war crime? For no matter how much death, destruction, and terrible oppression
Khamenei and the Iranian theocratic regime have on their conscience,
Putin is the greatest mass murderer of our time, also oppresses his people,
and the US has not bombed Moscow to date and has never made an attempt
to send the Russian president a one-way ticket to the afterlife.
Officially, the narrative regarding Iran is the same as for Afghanistan and Iraq: the
attacked regimes in the Middle East are supporters of jihadists and
terrorists; furthermore, they generally also want to wipe the State of Israel off the face of the earth
, oppress their own populations, fail to respect women’s rights,
and so on. And Israel has long been a partner of the U.S., a friendly nation.
That is the moral narrative that is presented. But what is really at stake
is, of course, much more about interests—or perceived interests—that must be defended
. Oil and gas are central to this.
The price of oil skyrocketed due to the new war, and that puts pressure on the
global economy, because it is inflationary and undermines purchasing power.
You-know-who also used the war primarily to manipulate the market
and make friends and family rich through insider trading.
At strategic moments, a message was sent out about the
war that could give the markets hope—or vice versa.
It is clear that insiders have been trading there, resulting in bizarre
price movements.
For us as managers and traders, all of this complicates matters, because
market manipulation makes the market unfair. Traders worldwide must be able to
rely on a level playing field where everyone has equal access to information; otherwise,
the result may be that parties leave the market, leading to a loss of
prosperity for everyone.
We now estimate that the U.S. will continue to wage war as long as the current administration remains in
power. After Iran comes Cuba, and who knows what else will follow in terms of
aggression and violence.
Because European countries will also continue to invest in the defense of
Europe—in this case against warring Russia—we must
likely continue to factor in a
war economy for successful investments.
OUR ALGORITHM CONTINUES TO WORK WELL
Despite everything, our algorithm continues to work well in this market.
We use this across various timeframes to calculate price targets; we are
quants, not pattern recognizers or technical analysts. We have thoroughly researched the
predictability of price patterns and tested them long ago
.
Quantitative approaches performed much better in all backtests, so mathematics
and statistics form the foundation of RVM Strategy and RVM Retirement.
Fundamental analysis also plays a central role at RVM Retirement in
selecting long-term investments.
An example of how our algorithm works is ASML.
ASML is currently not in the RVM Retirement portfolio, which is why we can
openly publish about it here.
We see that ASML is at the top of the calculation we perform every year using our
algorithm, in this case for the entire year of 2026.
Take a look:
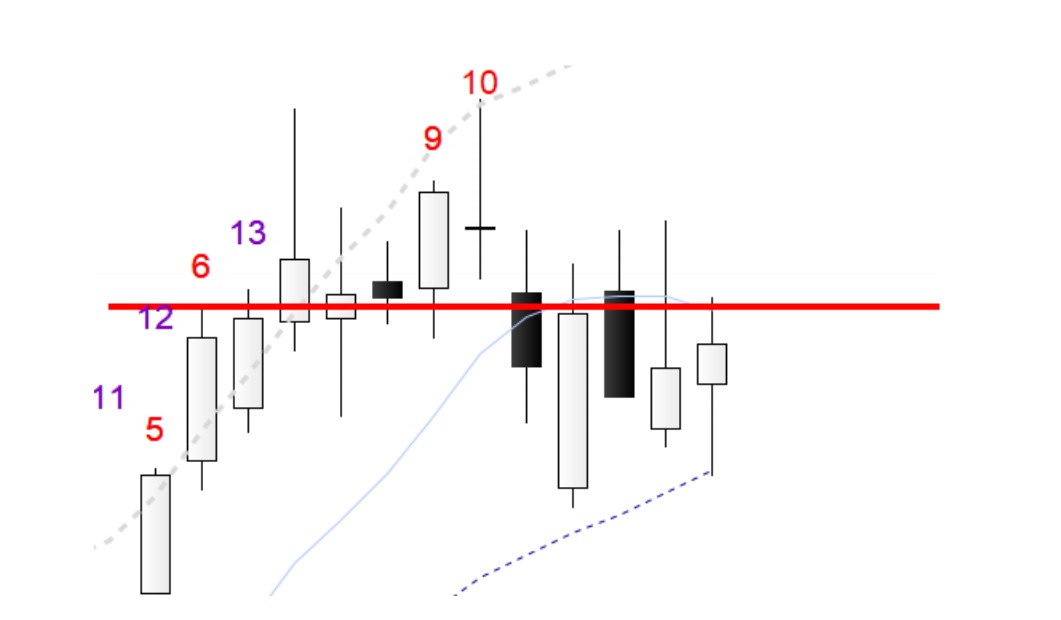
This is a section of ASML’s weekly chart.
The red line indicates the upper price limit calculated for this year, which is also
the calculated upside price target. This price target for 2026 was reached as early as
January, with a very strong price surge.
But you can see that since then, ASML has only temporarily risen above this level, and now that it is April
, we are still hovering around that level.
You can also see a purple “13”; this 13 is related to a quantitative
count, an objective attempt to, in this case, be alert to a possible
top formation in an underlying asset. The ‘13’ is the highest number that
is assigned; we do not go higher than ‘13’. So far, this has also proven to be a reasonably good
indicator that ASML’s price action had reached its peak. The red
count has not yet reached ‘13’, which in turn indicates that we can still expect further attempts to move higher
.
The fact that the price target calculation also turns out to be a resistance calculation does not always hold true
; Shell PLC, for example, exceeded our calculation
following the attack on Iran.
There are therefore always unexpected circumstances that can ‘outperform’ the results of our
algorithm.
Furthermore, an upward price target calculation is not necessarily a
resistance level; it is a minimum price target calculated for a
underlying asset.
OUR TRADING IN MARCH
It went smoothly, even though, due to Trump’s manipulation, we
found it necessary on one occasion to take profits on a position earlier than we had
hoped.
That concludes our review of March on the stock market.
Good luck with your investments!
Best regards,
On behalf of Van Megen Systematic Trading,
Ruud van Megen
SUBSCRIBE TO OUR SERVICES; MANY HAVE ALREADY JOINED US
If you haven’t yet subscribed to RVM Strategy, RVM Retirement, or RVM
Analysis, you’re more than welcome to join us!
Most investors who have decided to subscribe have never left